HMA
HMA
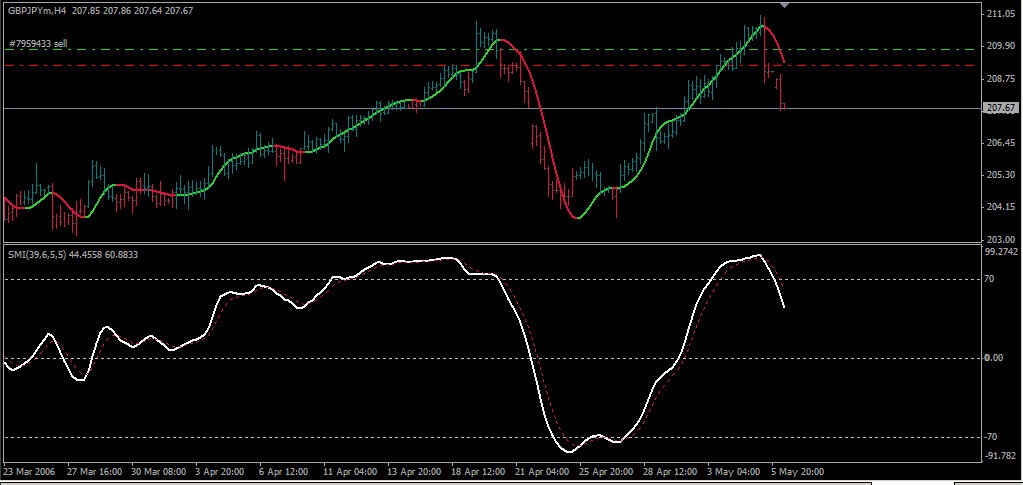
Based on the use of a slightly modified Hull Moving Average (HMA).
I added an indicator that paints the bars in different colours according to the HMA. It is auxiliary in nature and is used only for illustrative purposes.
Rules:
Buy when the HMA line is tilted upwards (green), and the SMI crosses the signal line from below, at the same time the indicator must not be in the overbought state (i.e. higher than 70).
Buy when the HMA line is tilted downwards (red), and the SMI crosses the signal line from above, at the same time the indicator must not be in the oversold state (i.e. lower than -70).
The initial stop loss is 150 points.
Half of the position is closed once the SMI reaches +80. For the second half, wait for the exit signal after moving the stop loss.
Fully close the position when the HMA reverses and SMI approaches the extremums (+70/-70)
The system works best with yen pairs.