Higher TimeFrame Trend Indicator
Higher TimeFrame Trend Indicator
This indicator displays the overall trend of a higher timeframe on the current (lower timeframe) chart as follows:
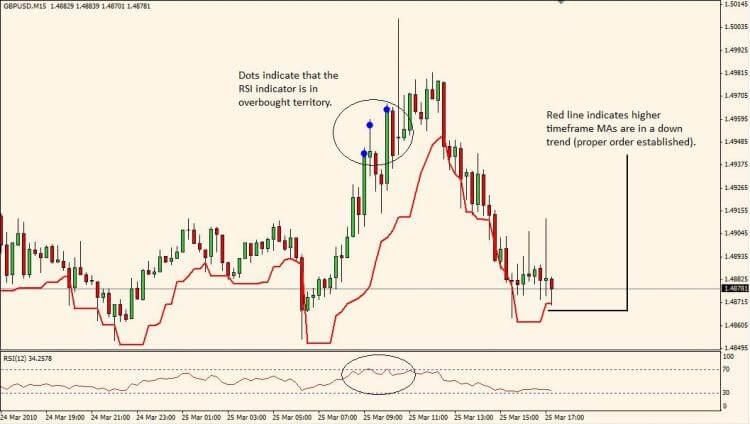
If MA_1 < MA_2 < MA_3 < MA_4 on the higher timeframe MA proper order has been established and a down trend is in place. On the current, lower timeframe chart and red line will appear to indicate this. The red line is based on the PCI (Price Channel Index) indicator and can be used as a support line. If in inbuilt RSI indicator is enabled, any time the RSI goes in overbought territory an alert is given as a warning that a possible reversal is more likely i.e. lower timeframe trend resumes higher timeframe overall trend. Entering on a close below the red PCI support line is recommended. See example picture below.
If MA_1 > MA_2 > MA_3 > MA_4 on the higher timeframe MA proper order has been established and a up trend is in place. On the current, lower timeframe chart and green line will appear to indicate this. The green line is based on the PCI (Price Channel Index) indicator and can be used as a resistance line. If in inbuilt RSI indicator is enabled, any time the RSI goes in oversold territory an alert is given as a warning that a possible reversal is more likely i.e. lower timeframe trend resumes higher timeframe overall trend. Entering on a close above the green PCI resistance line is recommended.
A grey line indicates that no higher timeframe trend is present.
Note: I recommend using the following timeframe combinations:
Higher Timeframe: Current Timeframe:
Daily 1hr
4hr 15min
1hr 5min
5/15min 1min