High, Low and Close of the previous day, week or month
High, Low and Close of the previous day, week or month
The indicator shows the High, Close and Low of the previous day, week or month. These levels are very commonly used as support and resistance among traders, so the indicator will draw them and leave a gap between periods to make it easy to distinguish when a new one started.
Settings:
- Precision: Which timeframe must be used to calculate the High, Close and Low of the period. This setting is required when a time shift is applied, otherwise, it can be ignored. For example, if you want the indicator to calculate the GMT 0 High, Close and Low for the period on a GMT 2 broker, you would need to set the Hour shift to -2 and Precision to H1 to allow the indicator to use the hourly chart for its calculation, it’ll affect the closing value, so choose wisely.
- Period: Previous day, previous week or previous month, you can only choose one of them. Add more instances of the indicator if want all modes are drawn.
- Periods to calculate: Specifies how many days, weeks or months should be drawn on the chart. This way, only the relevant prices will be calculated.
- Hours shift Self-explanatory. Be aware that it’ll require Precision to be set to at least H1.
- Minute’s shift: Self-explanatory. Be aware that it’ll require Precision to be set at a multiple of the minutes shift, e.g: A 15 minutes shift requires precision to be set at least to M15.
- Ignore Sunday: Sunday bars will be merged into Monday. Affects only the previous day mode.
- Ignore Saturday: Saturday bars will be merged into Friday. Affects only the previous day mode.
- Buffer visibility: Show/hide any of the lines if required.
- Probe visibility: Show/hide any of the value tags.
- Probe colour: Color of the value tags.
- Probe size: Value tag size.
- Data window label: Text displayed in the data window and tooltip for each line.
IMPORTANT: When timeshift and precision settings are used, the indicator may display the incorrect levels for a few seconds, this is because MetaTrader is downloading the required bars. So, if you use the H1 for precision, check if the bars were downloaded.
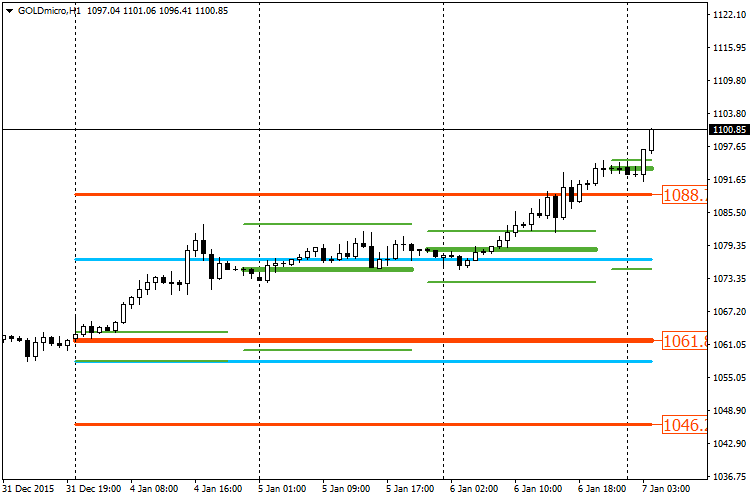
The following image shows High, Close and Low for Previous day(Green), Previous week(Blue) and Previous month(Red). 3 instances of the indicator were attached to the chart and as you can see, only the month lines show the value tag at the end of it(Probe settings). This template can be downloaded.