Graphically display current trend for all time frames in one simple panel
Graphically display current trend for all time frames in one simple panel
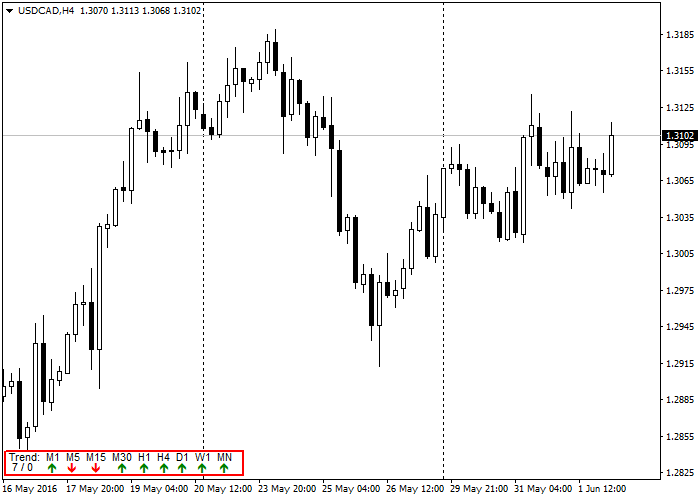
This is a graphical indicator based on a slope-direction-trend indicator that has been published under several other forms.
I have taken this indicator and made it into a graphical panel displaying all time frames and made a few slight modifications to the original code. One of them is that it allows the user to select the second moving average method used for smoothing. The original code used Linear Weighted for its second pass on the numbers whereas I give the user the option to choose the method for smoothing. When using Linear Weighted for both calculations, it makes the indicator too responsive and thus possibly giving false readings on the current trend. If we use Simple as the second averaging method we get a trend that is more indicative of where the price is going.
Another change that I have made is the ability to not only get the direction of the trend (up, down or flat) but also get its value. I will talk about this in another article I plan on publishing shortly on how to use a double SlopeDirection indicator and create an Expert Advisor with it.