Dots
Dots
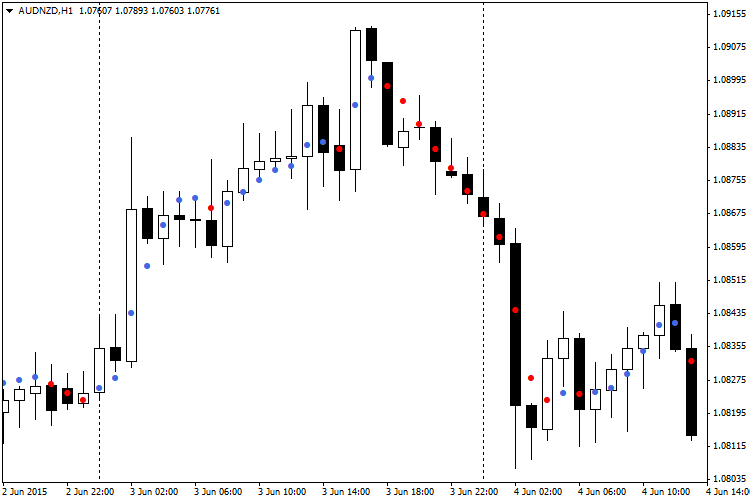
The Dots indicator is based on an indicator developed by TrendLaboratory in 2006. The indicator shows the current trend direction by placing coloured dots on the main chart. Blue dots indicate an uptrend, red dots indicate a downtrend.
Although the indicator calculation is not based on standard MetaTrader platform indicators, it uses the iMA (Moving Average) function to get prices of a specified type (Open, Close, Maximum, Minimum, Typical etc.). The calculation is based on the cosine of a price change angle. The user can set several input parameters.
Input Parameters:
- Length (by default = 10) — indicator period. The higher this value, the higher the time lag, and the fewer false signals are displayed.
- AppliedPrice (by default = PRICE_CLOSE) — price type to use in calculations.
- Filter (by default = 0) — useful parameter allowing to filter price surges without adding display lags.
- Deviation (by default = 0) — vertical indicator shift.
- Shift (by default = 0) — horizontal indicator shift.