DailyPivotPoints
DailyPivotPoints
The DailyPivot Points indicator helps to get the idea of the future market movements, unlike other tools that are usually behind the market.
Information that has become available during the previous day is used to calculate reference points for short trends of the current day.
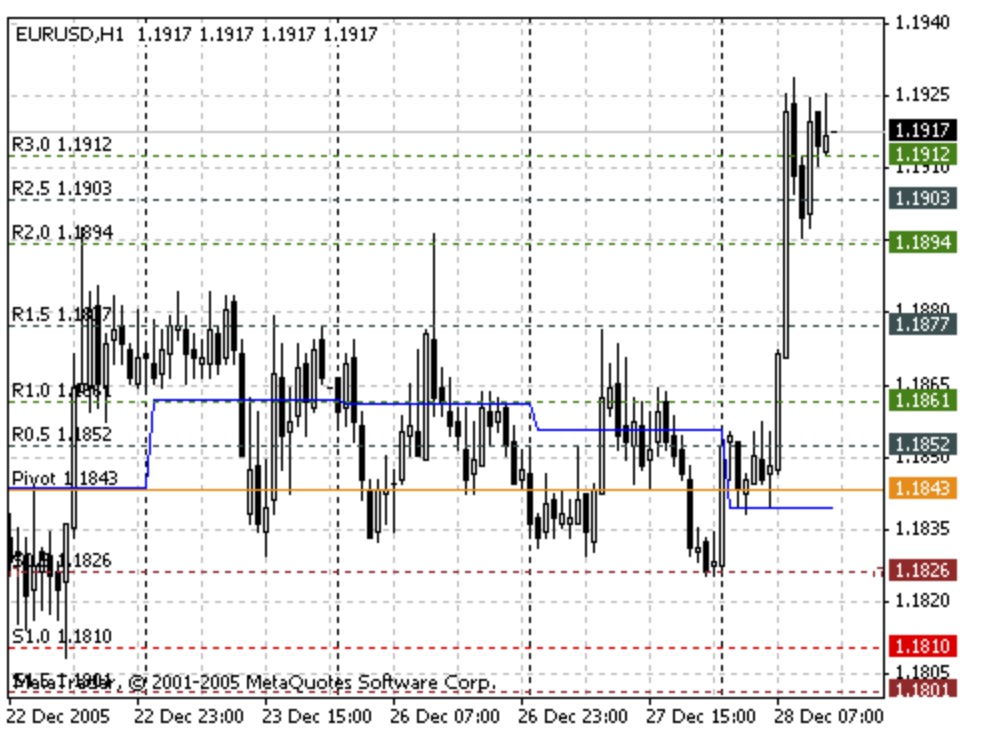
Pivot Point (PP) is the balance point, a level to which the price gravitates during the day. Having got three values of the previous day (High, Low, Close), one can calculate 13 levels for smaller timeframes: balance point, 6 resistance levels, and 6 support levels. These levels are named reference points. Reference points allow easy determination of changes in the short trend. The most important are the following three values: pivot point levels, Resistance1 (RES1.0), and Support1 (SUP1.0).
When the price moves between these values, breaks are often to be seen in the movement, even returns.
Thus, the DailyPivot Points indicator:
- forecasts the range of price fluctuations;
- shows where the price can stop;
- shows possible point of changes in the price movement direction.
If the market at the current day is opened above the pivot point level, that this is a signal for opening long position. If the market is opened below the pivot point level, that current day is favouring for opening short position.
The technique using pivot points consists in following and detecting probable turns or breakdowns at the price clashing the levels of resistance RES1.0 or support SUP1.0. By the moment of price reaching levels of RES2.0, RES3.0 or SUP2.0, SUP3.0, the market has normally been overbought or oversold, so these levels are mostly used as exit levels.
Calculation
Based on HIGH, LOW and CLOSE of the previous day, new values are generated Pivot Point (PP), Resistance1 (RES1.0), Resistance2 (RES2.0), Resistance3(RES3.0), Support1 (SUP1.0), Support2 (SUP2.0) and Support3 (SUP3.0), as well as intermediate values: Resistance0.5(RES0.5), Resistance1.5 (RES1.5), Resistance2.5 (RES2.5), Support0.5(SUP0.5), Support1.5 (SUP1.5) and Support2.5 (SUP2.5).
Thus, the highest and lowest prices of the previous day are projected on the future.
PP = (HIGH + LOW + CLOSE) / 3
RES1.0 = 2*PP – LOW
RES2.0 = PP + (HIGH -LOW)
RES3.0 = 2*PP + (HIGH – 2*LOW)
SUP1.0 = 2*PP – HIGH
SUP2.0 = PP – (HIGH – LOW)
SUP3.0 = 2*PP – (2*HIGH – LOW)
RES0.5 = (PP + RES1.0) / 2
RES1.5 = (RES1.0 + RES2.0) / 2
RES2.5 = (RES2.0 + RES3.0) / 2
SUP0.5 = (PP + SUP1.0) / 2
SUP1.5 = (SUP1.0 + SUP2.0) / 2
SUP2.5 = (SUP2.0 + SUP3.0) / 2
where:
- HIGH — the highest price of the previous day;
- LOW — the lowest price of the previous day;
- CLOSE — close price of the previous day;
- PP — pivot point (typical price of the previous day);
- RES0.5, RES1.0, RES1.5, RES2.0, RES2.5, RES3.0 — reference points (resistance levels);
- SUP0.5, SUP1.0, SUP1.5, SUP2.0, SUP2.5, SUP3.0 — reference points (support points).