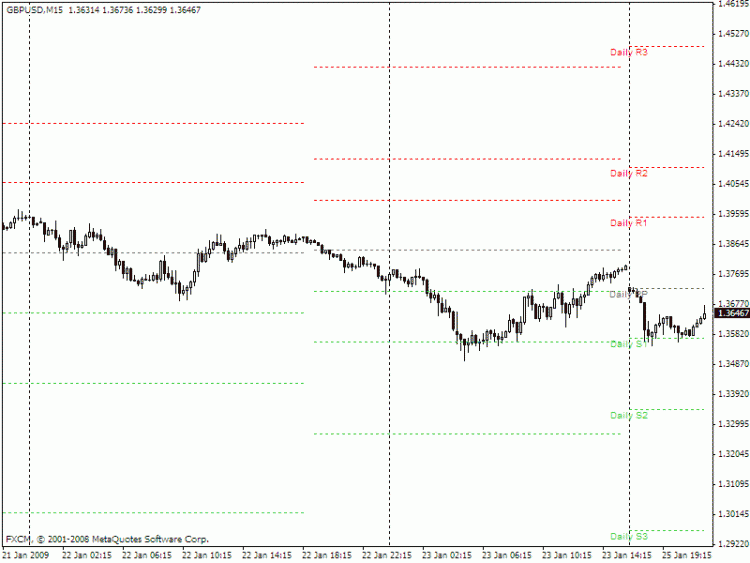
Daily Pivot Points shifted for different day start time
Daily Pivot Points shifted for different day start time
This indicator plots horizontal lines at daily pivot levels R3, R2, R1, Pivot, S1, S2 & S3, using a day that is advanced (or retarded) from the server time (called Pivot Day). You can see in the illustration, that the pivot lines start earlier than the server time days (except for the most recent day because it was a weekend).
The only input is the integer “ShiftHrs”, which gives the number of hours to advance the pivot day. A negative value delays the day for pivot calculation. For example, if your server is on New York time (GMT-5) and you want pivot points in London time (GMT), then ShiftHrs is set to +5 (the default in the code).
Saturday and Sunday trading is not ignored (after all it was real trading). If the pivot day shift results in data appearing on Saturday, it was really Friday where it occurred, so the indicator treats it as part of Friday. If the pivot day shift results in data appearing on Sunday, it was really Monday where it occurred, so the indicator treats it as of Monday.
It uses an indicator buffer for each line, so pivot levels of previous days remain visible. (This has a negative consequence: it is not possible to use the same technique to draw additional intermediate levels (S0.5, S1.5, etc.) because of the limit of 8 buffers.)
Labels are shown for the most recent day’s levels.
This indicator can be applied to any chart period, although daily pivots on charts with long periods are meaningless.
The formulae for the caluclations are:
Pivot = ( High + Low + Close ) / 3
Range = High – Low
Resistance1 = 2 * Pivot – Low
Resistance2 = Pivot + Range
Resistance3 = Resistance1 + Range
Support1 = 2 * Pivot – High
Support2 = Pivot – Range
Support3 = Support1 – Range
