CheckMark pattern
CheckMark pattern
Purpose of the pattern – predict the type of the next candle: bullish or bearish. It has no further effect.
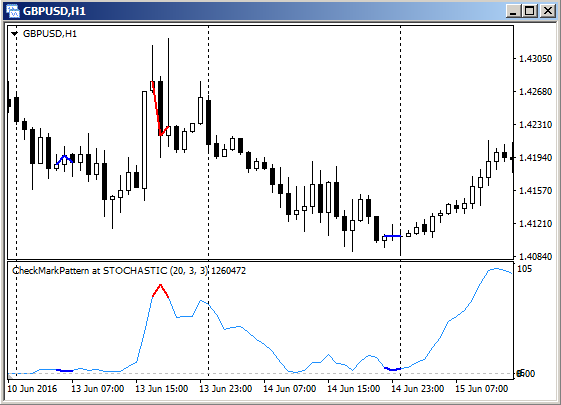
The “CheckMark” pattern is plotted the same way as the divergence lines, which means that a price chart alone is not enough for finding it. An additional indicator is also required. This task is performed best by various oscillators.
Formation of the pattern involves three last bars. It is necessary to connect the Close prices of bars bylines, and on the oscillator chart — simply highlight three last vales. If “checkmarks” are obtained from both charts and they have different vertical orientations, then the “CheckMark” pattern is found. The local minimum on the oscillator chart is a bullish pattern (blue), the local maximum is bearish (red).