CCI on Step Channel
CCI on Step Channel
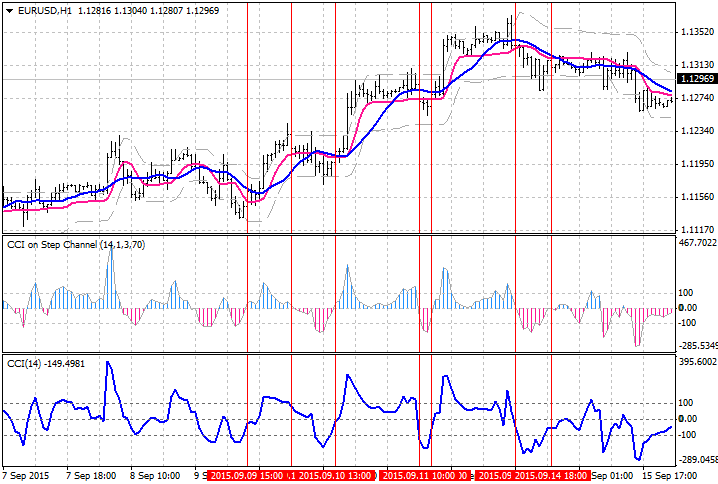
The classic CCI indicator uses the Moving Average of the Typical price. This version uses a median line of the Step Channel indicator.
This line will be created from the result of the tug of war between [raising price] and [falling price].
This chart shows the differences.
- Blue Line is Typical SMA(14),
- Pink Line is Volatility Step Channel(StdDev(1.0), Ma(3), Volatility(70)).