Automatic Parabolic Support and Resistance Levels Indicator
Automatic Parabolic Support and Resistance Levels Indicator
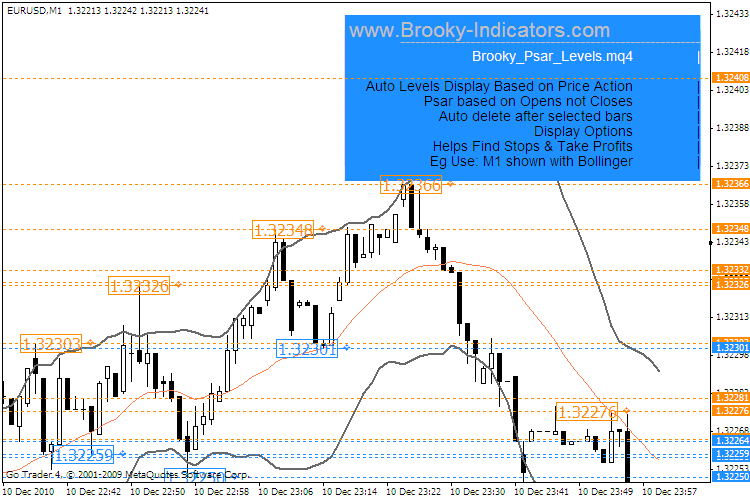
This indicator will draw the levels and then delete them if older than your selected bars. The turn is calculated on above/below opens not closes as that seems to get most of the turns and this makes it slightly different than just the dots from a programming point of view.
Very basically the more previous crosses in bars past that are close together show the strength of the resistance/support level. I have noticed that price tends to want to break
into clear ground which is easy to see as clear chart area.