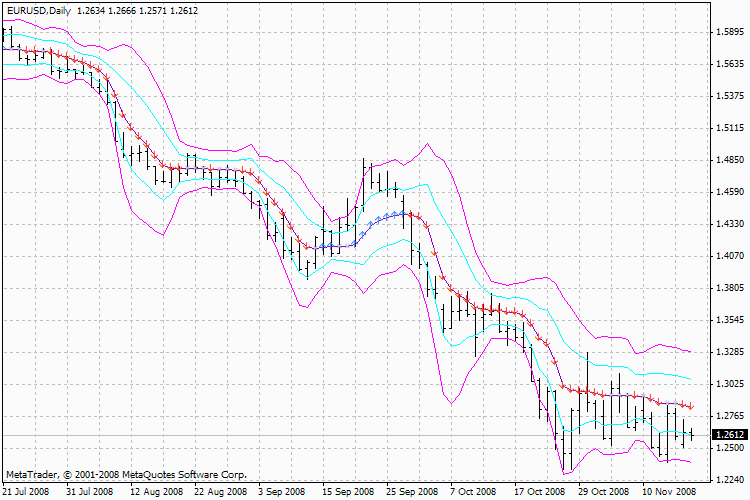
AMA Bands
AMA Bands
As compared to the original code (WellxAMA), the calculation of AMA is written as the calculation of the ouput value of the adaptive integrator (by the way, it is where the value of the exponential moving average comes from) that allows us to recalculate only the last and the next to the last bar, or the last one only. The arrows on the chart represent signals. Their sense is the first AMA derivative on a single timeframe.


