2 MA Channel Breakout
2 MA Channel Breakout
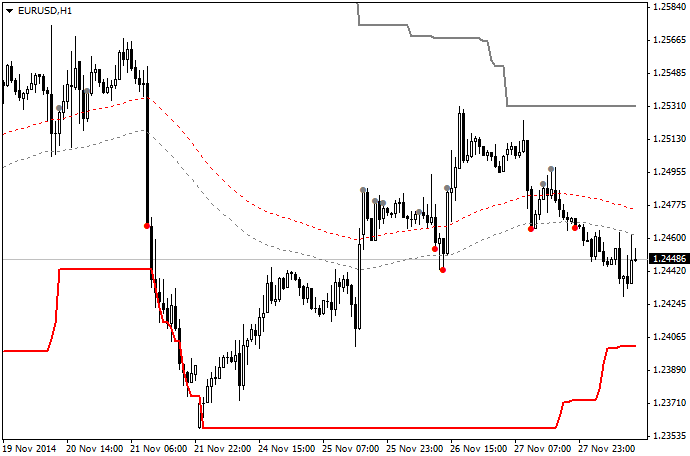
This indicator is based on the cross of a slow and fast EMA_close(not drew) for the main trend, then at the breakout( close of the candle) of high/low channel a dot appears, if is white set a buy order a the level of the dot, sell if is red.
The two-dot line is the SL level (HI-LO channel calculated on xx EMA), the white is for the buy, the red is for the sell operation, the two thick lines are the TP level (Highest high since XX bars and Lowest low since XX bars).
Is my first indicator, feel free to make comments or some suggestions to improve it.
I use 89 for the faster EMA and 144 for the slower and 89 for the SL and TP, and I suggest using it in a 1H or higher time frame.
I wish to create an EA with that indicator, that uses the last entry signal level as pending order for buy/sell and a good system of trailing SL and TP.